http://groups.google.com/group/freeware-news?hl=en
freeware-news@googlegroups.com
Today's topics:
* 2008-02-19 - 1 messages, 1 author
http://groups.google.com/group/freeware-news/browse_thread/thread/4bb8aee377569566?hl=en
==============================================================================
TOPIC: 2008-02-19
http://groups.google.com/group/freeware-news/browse_thread/thread/4bb8aee377569566?hl=en
==============================================================================
== 1 of 1 ==
Date: Mon, Feb 18 2008 9:04 pm
From: "L. Toldy"
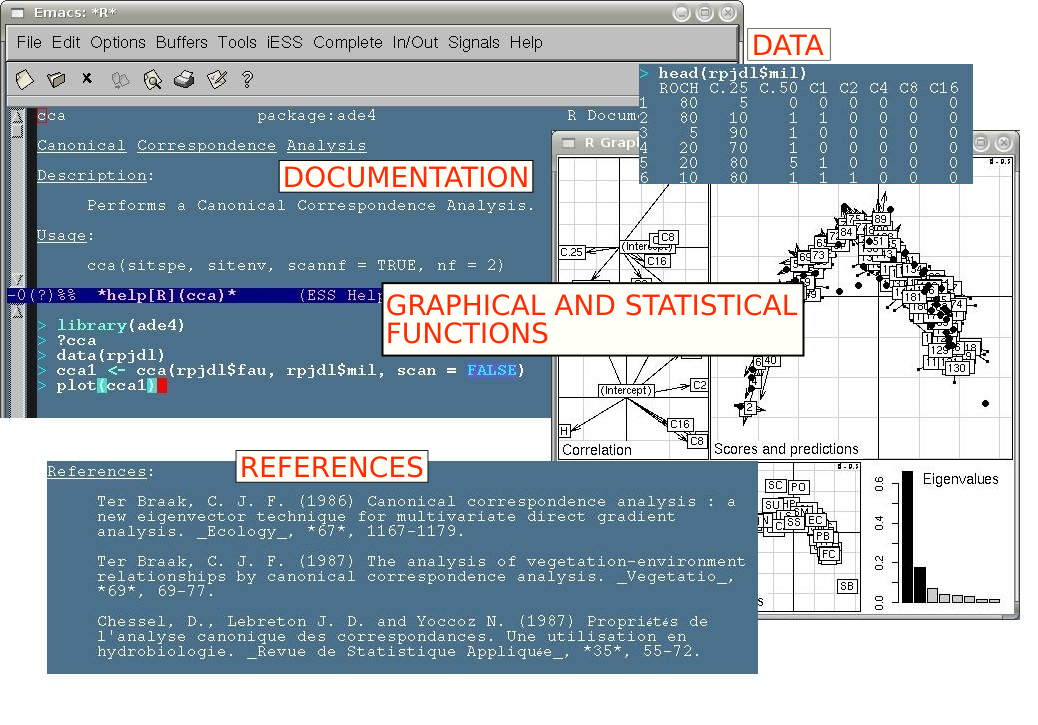
ade4 v1.4-5 - 2891 KB
ade4 is a software developed in the Biometry and Evolutionary Biology Lab (UMR 5558) - University Lyon 1. It contains Data Analysis functions to analyse Ecological and Environmental data in the framework of Euclidean Exploratory methods, hence the name ade4.
ade4 is characterized by :
- the implementation of graphical and statistical functions
- the availability of numerical data
- the redaction of technical and thematic documentation
- the inclusion of bibliographic references
Since 2002, ade4 is a package of the R software, available for Windows, Mac OS, Linux et Unix OS. One-table methods are described in Chessel et al. (2004)
HUNGARIAN/MAGYAR:
Ökológia és környezeti adatok biometrikai analizálása
http://pbil.univ-lyon1.fr/ADE-4/pictures/ade4e.png
Biometry and Evolutionary Biology Lab
webmaster@univ-lyon.fr
http://pbil.univ-lyon1.fr/ADE-4/home.php?lang=eng
http://cran.univ-lyon1.fr/bin/windows/contrib/r-release/ade4_1.4-5.zip
methodolohy - 687+1375 KB:
http://pbil.univ-lyon1.fr/JTHome/ref/ade4-Rnews.pdf
http://cran.univ-lyon1.fr/doc/packages/ade4.pdf
Dataplot - 22213/43464/26722 KB
Dataplot is a free, public-domain, multi-platform (Unix, VMS, Linux, Windows 95/98/ME/XP/NT/2000, etc.) software system for scientific visualization, statistical analysis, and non-linear modeling. The target Dataplot user is the researcher and analyst engaged in the characterization, modeling, visualization, analysis, monitoring, and optimization of scientific and engineering processes. The original version was released by James J. Filliben in 1978 with continual enhancements to present. Authors: James J. Filliben and Alan Heckert Statistical Engineering Division, Information Technology Laboratory, National Institute of Standards and Technology, with tcl/tk GUI interface by Robert R. Lipman, formerly of the Mathematical and Computational Sciences Division. Project co-sponsor: HPCC / SIMA.
HUNGARIAN/MAGYAR:
Public domain tudományos vizualizációs szoftver statisztikai analízisekhez és nemlineáris modellekhez
http://freestatistics.altervista.org/screenshot/DataplotShot1.jpg
NIST
alan.heckert@nist.gov
http://www.itl.nist.gov/div898/software/dataplot/homepage.htm
for Windows 95/98/NT4/ME - 22213 KB:
http://www.itl.nist.gov/div898/software/dataplot/ftp/pc/setup.exe
for Windows 2000/XP - 43464 KB:
http://www.itl.nist.gov/div898/software/dataplot/ftp/win_2000/setup.exe
for Windows Vista - 26722 KB:
http://www.itl.nist.gov/div898/software/dataplot/ftp/win_vista/setup.exe
Instat v3.36 - 46299 KB
Instat is a general statistical package. It is simple enough to be useful in teaching statistical ideas, yet has the power to assist research in any discipline that requires the analysis of data.
Instat began life around 20 years ago on a BBC microcomputer. It was first used on a training course on 'statistics in agriculture' held in Sri Lanka during 1983. The BBC micro version was marketed commercially from mid-1985, with the DOS version for PCs becoming available in 1987. From 1994 Instat was free-of-charge. Updated DOS versions were released in 1996 and 1997.
Instat has been used widely in the UK and elsewhere by a range of companies, research institutes, schools, colleges, universities and private individuals. At The University of Reading it has been used extensively on training courses run by the SSC and the School of Applied Statistics. It has also been used in many countries on statistics courses and on courses related to health, agriculture and climatology.
'Instat+' (i.e. the Windows version of Instat) has been developed mainly because of its continued use for the analysis of climatic data. Funding from the UK Met Office for a new climatic version, supplemented by support from the SSC and the efforts of other friendly collaborators, led to the Windows version, which was first used on training courses in 1999.
The full version of Instat may be downloaded and used for non-commercial purposes by any individual free of charge. There is no copy-protection, time limit or data size restriction, other than Instat's inherent size limitations.
SSC-Stat is an add-in for Microsoft Excel. Many people start with their data in Excel, so it is logical to build on that and add some features often needed for statistical analysis.
SSC-Stat is designed to strengthen those areas where the spreadsheet package is already strong, principally in the areas of data management, graphics and descriptive statistics.
HUNGARIAN/MAGYAR:
Általános statisztikai analízis
http://freestatistics.altervista.org/screenshot/InstatShot1.jpg
Statistical Services Centre
instat@lists.rdg.ac.uk
http://www.rdg.ac.uk/ssc/software/instat/instat.html
http://www.rdg.ac.uk/ssc/software/instat/336/Instat%2B%20v3.36.msi
SSC-Stat v2.18 - 5667 KB:
http://www.rdg.ac.uk/ssc/software/sscstat/SSC-Stat%20v2.18%20setup.exe
KyPlot v2.0 beta 15 - 4900 KB
KyPlot: a professional data-analyzing, graphing and drawing application
KyPlot is designed to analyze data and create graphs and schemes. It is particularly suited for scientists who would like to make precise and refined graphs and schemes.
KyPlot is a Windows application and is available as 16-bit or 32-bit version.
The 16-bit version runs in Windows 3.1, 95/98/Me and NT3.5 or more and the 32-bit version runs in Windows 95/98/Me and NT4.0/2000.
Even with the 16-bit version you can use long file names in 32-bit Windows.
KyPlot consists of "spreads" for processing data and "figures" for drawing graphs and schemes.
KyPlot has those diagrams scientists are missing in Excel and StarOffice (surface & contour)
KyPlot can do data-fiting (and other numerical computing) in many shemes.
KyPlot is small, 4.8 standard / 7.8 fast-version, but compatible to Excel.
This is a beta version of KyPlot. You are free to use it, but with your own responsibility. The author shall take no responsibility for any trouble associated with the use of this software package.
This software package - including all related program files and documentation files - cannot be modified in any way and must be distributed as a complete package. It cannot be sold upon distribution.
HUNGARIAN/MAGYAR:
Professzionális adatanalizáló, grafikon készítõ program
http://www.woundedmoon.org/win32/kyplot.png
Koichi Yoshioka
kyoshi@ja2.so-net.ne.jp
http://www.woundedmoon.org/win32/kyplot.html
http://woundedmoon.org/win32/kyp2b15.exe
version 2.0 beta 13f - 8116 KB:
http://woundedmoon.org/win32/kyp2b13f.exe
version 2.0 beta 13 - 4898 KB:
http://woundedmoon.org/win32/kyp2b13.exe
sample files - 7671 KB:
http://ael.physic.ut.ee/vaba/KyPlot/SamplesE/00List.kyp
http://ael.physic.ut.ee/vaba/KyPlot/SamplesE/01Scheme.kyp
http://ael.physic.ut.ee/vaba/KyPlot/SamplesE/02Funpl.kyp
http://ael.physic.ut.ee/vaba/KyPlot/SamplesE/03Cont.kyp
http://ael.physic.ut.ee/vaba/KyPlot/SamplesE/04Break.kyp
http://ael.physic.ut.ee/vaba/KyPlot/SamplesE/05Boxwhi.kyp
http://ael.physic.ut.ee/vaba/KyPlot/SamplesE/06Multf.kyp
http://ael.physic.ut.ee/vaba/KyPlot/SamplesE/07Trace.kyp
http://ael.physic.ut.ee/vaba/KyPlot/SamplesE/08Eia.kyp
http://ael.physic.ut.ee/vaba/KyPlot/SamplesE/09Logit.kyp
http://ael.physic.ut.ee/vaba/KyPlot/SamplesE/10Deconv.kyp
http://ael.physic.ut.ee/vaba/KyPlot/SamplesE/11Spectr.kyp
http://ael.physic.ut.ee/vaba/KyPlot/SamplesE/12Timser.kyp
http://ael.physic.ut.ee/vaba/KyPlot/SamplesE/13Varspe.kyp
http://ael.physic.ut.ee/vaba/KyPlot/SamplesE/14Schild.kyp
http://ael.physic.ut.ee/vaba/KyPlot/SamplesE/15WtDWT.kyp
http://ael.physic.ut.ee/vaba/KyPlot/SamplesE/16Wtreg.kyp
http://ael.physic.ut.ee/vaba/KyPlot/SamplesE/17WtCWT.kyp
http://ael.physic.ut.ee/vaba/KyPlot/SamplesE/18Gabor.kyp
http://ael.physic.ut.ee/vaba/KyPlot/SamplesE/19Assay.kyp
http://ael.physic.ut.ee/vaba/KyPlot/SamplesE/20Quadr.kyp
http://ael.physic.ut.ee/vaba/KyPlot/SamplesE/21Polyr.kyp
http://ael.physic.ut.ee/vaba/KyPlot/SamplesE/22Optim.kyp
http://ael.physic.ut.ee/vaba/KyPlot/SamplesE/23Orddif.kyp
http://ael.physic.ut.ee/vaba/KyPlot/SamplesE/24Call.kyp
http://ael.physic.ut.ee/vaba/KyPlot/SamplesE/25Smooth.kyp
http://ael.physic.ut.ee/vaba/KyPlot/SamplesE/26Float.kyp
http://ael.physic.ut.ee/vaba/KyPlot/SamplesE/27PolHis.kyp
http://ael.physic.ut.ee/vaba/KyPlot/SamplesE/28Disc.kyp
http://ael.physic.ut.ee/vaba/KyPlot/SamplesE/29Clust.kyp
http://ael.physic.ut.ee/vaba/KyPlot/SamplesE/30Factor.kyp
http://ael.physic.ut.ee/vaba/KyPlot/SamplesE/31Weib.kyp
http://ael.physic.ut.ee/vaba/KyPlot/SamplesE/32Survi.kyp
http://ael.physic.ut.ee/vaba/KyPlot/SamplesE/33Surf.kyp
http://ael.physic.ut.ee/vaba/KyPlot/SamplesE/34Cont3.kyp
MacAnova v5.05 - 8752 KB
MacAnova is a free, open source, interactive statistical analysis program for Windows, Macintosh, and Linux written by Gary W. Oehlert and Christopher Bingham, both of the School of Statistics, University of Minnesota.
In spite of its name, MacAnova is not just for Macintosh computers and not just for doing Analysis of Variance.
MacAnova has many capabilities but its strengths are analysis of variance and related models, matrix algebra, time series analysis (time and frequency domain), and (to a lesser extent) uni- and multi-variate exploratory statistics. The current version is 5.05 release 1.
Core MacAnova has a functional/command oriented interface, but an increasing number of capabilities are available through a menu/dialog/mouse type interface. Although the language and syntax are S-like (for those of you familiar with S, S-Plus or R), MacAnova is not S or R.
HUNGARIAN/MAGYAR:
Interaktív statisztikai analízis és mátrix algebrai program
http://freestatistics.altervista.org/screenshot/MacanovaShot1.jpg
University of Minnesota School of Statistics
gary@stat.umn.edu
http://www.stat.umn.edu/macanova/macanova.home.html
ftp://ftp.stat.umn.edu/pub/macanova/dos/MacAnova5.05.3.exe
MicrOsiris v9.2c - 4933 KB
MicrOsiris is a comprehensive statistical and data management package for Windows based microcomputer systems. It is derived from OSIRIS IV, a statistical and data management package developed and used at the University of Michigan.
Developed for serious survey analysis using moderate to large data sets, MicrOsiris's speed and minimal disk storage requirement, coupled with the interactive dialogs and on-line help systems, make it also suitable for college or graduate level courses in statistics and applied survey research methods. Further, the interactive statistical decision tree for choosing appropriate statistical techniques is a comprehensive decision tool---not just for using MicrOsiris.
MicrOsiris accepts as many cases as you can get on your system. There are interactive dialogs for managing MicrOsiris sessions and an on-line help facility for aid in running a particular command. SAS and SPSS files can be easily imported Windows XP or above.
Key Benefits
1. Handles any size data set.
2. Interactive dialogs and batched runfiles.
3. Data entry with Excel
4. Imports and exports to SAS, SPSS, STATA
5. Special Data Mining techniques for market analysis (SEARCH --very fast for large datasets).
6. Interactive statistical decision tree for selecting appropriate statistics.
7. Special nominal and ordinal statistical analysis techniques (MCA, MNA).
8. Can read OSIRIS data sets from the Institute for Political and Social Research (ICPSR).
9. Reads UNESCO IDAMS datasets.
10. Online manual
11. Decision Tree for choosing statistics and commands to compute them
12. Online context sensitive help system with additional links to manual.
13. Requires only 6MB when fully loaded; additional memory allocated as needed depending on number of variables used.
14. Less than 12MB on disk--including manual and Statistical Decision Tree.
HUNGARIAN/MAGYAR:
Statisztikai és adatmenedzser programcsomag az OSIRIS IV statisztikai programcsomagra alapozva
http://freestatistics.altervista.org/screenshot/MicrosirisShot1.jpg
Van Eck Computer Consulting
neal.vaneck@verizon.net
http://www.microsiris.com/
http://www.microsiris.com/MOSETUP.exe
OpenStat - 5523 KB
OpenStat is a general purpose statistics package that you can download and install for free. It was originally written as an aid in the teaching of statistics to the students enrolled in a social science program. It has been expanded to provide procedures useful in a wide variety of disciplines. It is not a "finished" product but revised several times a year. The version is denoted by the month, day and year. For example 1.27.08 would indicate a revision released in January 27, 2008. The program is NOT to be used for commercial purposes and there is no warranty implied. Most users check results by hand or compare to commercial packages to which they have access to insure the results are correct.
HUNGARIAN/MAGYAR:
Általános célú statisztikai programcsomag
http://www.statpages.org/miller/openstat/Image18.gif
Bill Miller
OpenStat@msn.com
http://www.statpages.org/miller/openstat/
http://www.statpages.org/miller/openstat/OpenStatSetup.exe
guide - 4220+7199 KB:
http://www.statpages.org/miller/openstat/QuickGuide.pdf
http://www.statpages.org/miller/openstat/ATextBook.pdf
samples - 65 KB:
http://www.statpages.org/miller/openstat/OpenStatTabData.zip
R Statistical Software v2.6.2 - 30229 KB
R is a language and environment for statistical computing and graphics. It is a GNU project which is similar to the S language and environment which was developed at Bell Laboratories (formerly AT&T, now Lucent Technologies) by John Chambers and colleagues. R can be considered as a different implementation of S. There are some important differences, but much code written for S runs unaltered under R.
R provides a wide variety of statistical (linear and nonlinear modelling, classical statistical tests, time-series analysis, classification, clustering, ...) and graphical techniques, and is highly extensible. The S language is often the vehicle of choice for research in statistical methodology, and R provides an Open Source route to participation in that activity.
One of R's strengths is the ease with which well-designed publication-quality plots can be produced, including mathematical symbols and formulae where needed. Great care has been taken over the defaults for the minor design choices in graphics, but the user retains full control.
R is an integrated suite of software facilities for data manipulation, calculation and graphical display. It includes
- an effective data handling and storage facility,
- a suite of operators for calculations on arrays, in particular matrices,
- a large, coherent, integrated collection of intermediate tools for data analysis,
- graphical facilities for data analysis and display either on-screen or on hardcopy, and
- a well-developed, simple and effective programming language which includes conditionals, loops, user-defined recursive functions and input and output facilities.
The term "environment" is intended to characterize it as a fully planned and coherent system, rather than an incremental accretion of very specific and inflexible tools, as is frequently the case with other data analysis software
HUNGARIAN/MAGYAR:
Az R egy programozási nylv és grafikus környezet statisztikai és grafikai feldolgozásokhoz Unix, Windows és Max OSX környezetben.
http://freestatistics.altervista.org/screenshot/RShot1.jpg
http://www.r-project.org/hpgraphic.png
The R Project
Uwe.Ligges@R-project.org
http://www.r-project.org/
http://cran.r-project.org/bin/windows/base/R-2.6.2-win32.exe
TANAGRA - 3080 KB
TANAGRA is an "open source project" as every researcher can access to the source code, and add his own algorithms, as far as he agrees and conforms to the software distribution license.
The main purpose of Tanagra project is to give researchers and students an easy-to-use data mining software, conforming to the present norms of the software development in this domain (especially in the design of its GUI and the way to use it), and allowing to analyse either real or synthetic data.
The second purpose of TANAGRA is to propose to researchers an architecture allowing them to easily add their own data mining methods, to compare their performances. TANAGRA acts more as an experimental platform in order to let them go to the essential of their work, dispensing them to deal with the unpleasant part in the programmation of this kind of tools : the data management.
The third and last purpose, in direction of novice developers, consists in diffusing a possible methodology for building this kind of software. They should take advantage of free access to source code, to look how this sort of software is built, the problems to avoid, the main steps of the project, and which tools and code libraries to use for. In this way, Tanagra can be considered as a pedagogical tool for learning programming techniques.
HUNGARIAN/MAGYAR:
Nyilt forráskódú adatbányász program
http://eric.univ-lyon2.fr/~ricco/tanagra/images/galerie_interface_tanagra.jpg
Ricco RAKOTOMALALA
secretariat@eric.univ-lyon2.fr
http://eric.univ-lyon2.fr/~ricco/tanagra/en/tanagra.html
http://eric.univ-lyon2.fr/~ricco/tanagra/fichiers/setup_tanagra.exe
ViSta v6.4 - 4236 KB
ViSta, the Visual Statistics System, features statistical visualizations that are highly dynamic and very interactive.
- Dynamic, High-Interaction, Multi-View Graphics: ViSta constructs very-high-interaction, dynamic graphics that show you multiple views of your data simultaneously. The graphics are designed to augment your visual intuition so that you can better understand your data.
- See What Your Data Have To Say: ViSta's visually intuitive and computationally intensive approach to statistical data analysis is designed to clarify the meaning of data so that you can · see what your data have to say.
- Freeware/Open Software: ViSta is free and open.
- Platforms: ViSta runs under Windows, on Macintosh, and under Unix.
- Languages: ViSta is available in English, Français, and Espanol.
- Look and Feel: ViSta has a Structured Graphical Interface that includes
- WorkMaps that visually summarize your data analysis session
- SpreadPlots - a spreadsheet-like arrangement of linked, dynamic, interactive plots that show you what your data or analysis seems to say
- GuideMaps that guide your analysis
- DataSheets for inputing and editing your data
- Visual GuideMap Authoring for teachers who wish to create guidemaps
- Reports present data statistics and analysis results in the classical way
- Context-Sensitive Help and Web-based Help and Notes
- Statistical Capabilities: ViSta performs Univariate and Multivariate Statistical Visualization and Data Analysis.
- Applets, Plugins, Scripts and DataPrograms:
- Applets: Teachers can develop ViSta Web Applets for demonstrations, examples, test problems, etc. Students can download and run these on their own machines (example of class notes using an applet).
- Scripts: Teachers can write ViSta scripts using the same techniques as for Applets, but keep them privately on their machines. A grading script is an example.
- DataPrograms: Teachers and students can write dataprograms to manipulate their data.
- Plugins: Programmers can develop plugins to add entirely new data analysis and visualization capabilities.
- Developer's Tools: ViSta provides access to the underlying development languages, including:
- ViDAL, ViSta's Data Analysis Language for writing applets, scripts and data programs; and
- XLispStat, an object-oriented programming language which can be used to write ViSta plugins for statistical computing and dynamic graphics.
- XLisp, a free and open Lisp system satisfying most of the Common Lisp standards.
- C++ and FORTRAN may be used for developing specialized new features.
In addition, ViSta has developers tools including a byte-code compiler, a stepper, tracing and back tracing, object and bitmap editors, distribution maker, etc...
HUNGARIAN/MAGYAR:
Vizuális statisztikai rendszer
http://forrest.psych.unc.edu/research/vista-frames/gif/desktop.gif
Forrest W. Young
forrest@unc.edu
http://forrest.psych.unc.edu/research/index.html
http://forrest.psych.unc.edu/research/vista-frames/ftp/WinViSta6/ViSta64-Installer.exe
plugins - 785+934+773+767 KB:
http://forrest.psych.unc.edu/research/vista-frames/ftp/WinViSta6/Loglin64-Installer.exe
http://forrest.psych.unc.edu/research/vista-frames/ftp/WinViSta6/MulVar64-Installer.exe
http://forrest.psych.unc.edu/research/vista-frames/ftp/WinViSta6/Homals64-Installer.exe
http://forrest.psych.unc.edu/research/vista-frames/ftp/WinViSta6/MulLev64-Installer.exe
documentation - 4502 KB:
http://forrest.psych.unc.edu/research/vista-frames/pdf/HowToUseViSta.pdf
--
Get paid for reading advertisement emails:
http://hits4pay.com/members/index.cgi?papoman
==============================================================================
You received this message because you are subscribed to the Google Groups "freeware news"
group.
To post to this group, send email to freeware-news@googlegroups.com or visit http://groups.google.com/group/freeware-news?hl=en
To unsubscribe from this group, send email to freeware-news-unsubscribe@googlegroups.com
To change the way you get mail from this group, visit:
http://groups.google.com/group/freeware-news/subscribe?hl=en
To report abuse, send email explaining the problem to abuse@googlegroups.com
==============================================================================
Google Groups: http://groups.google.com?hl=en
No comments:
Post a Comment